.png)

When implementing a system involving both software and hardware components, unforeseen issues always seem to occur at the interfaces. Today we will look at one such pain points that occurs when transferring large amounts of data from a software application running on a typical x86 host machine to an FPGA for accelerated computation. Specifically we look at an issue we faced at Ingonyama while implementing an FPGA accelerated Multi-Scalar-Multiplication (MSM) application on the AWS F1 instances.
The Architecture
First, let’s step back and take a high level view of the problem and the basic architecture of the system. Multi-Scalar-Multiplication is one of the major computational bottlenecks at the core of many Zero-Knowledge-Proof systems. Essentially an MSM operation is defined as:
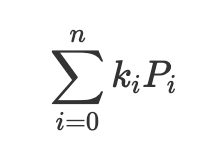
Where Pᵢ are points on some elliptic curve and kᵢ is simply a scalar integer. For this post we will assume we are dealing with 32-byte scalars and 64-byte point representations. So somewhere in our software we have at runtime a vector of scalars (n×32n×32 bytes) and a vector of points (n×64n×64 bytes), which need to be transferred to the FPGA for computation.
On the hardware side, we have implemented in the FPGA an MSM computation core which has two streaming ports, each connected to a FIFO/Queue that sinks incoming data transfers from the host.
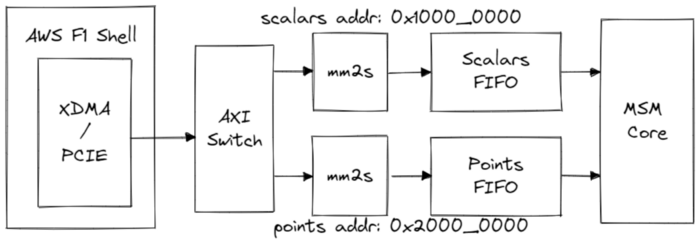
The AWS shell presents us with a single 512-bit AXI4 memory-mapped bus from which we will receive data from the host. This bus is connected to two memory-mapped-to-stream converters through an AXI switch and each converter is assigned an address range on the bus. Any write transactions that hit within their respective address ranges will have the transaction data packets pushed into the FIFO.
The AWS F1 Shell implements a DMA engine that is compliant with the Xilinx provided (XDMA) drivers. The purpose of a DMA is to offload from the CPU, the responsibility of transferring large amounts of data. In this case, transferring data from host memory to the FPGA device. Using CPU cores to transfer data usually has low latency, however it is very inefficient for large amounts of data and can result in low performance, so we would much rather use a DMA for the task. It is important to note that DMA operations typically have a high latency as they are two step processes. The CPU must first configure the DMA engine, then the DMA will go fetch the data. Rather than the CPU simply writing directly to the FIFO/memory on the FPGA. The advantage of DMA is the ability to transfer at a high throughput.
Now that we have an idea of how the hardware is connected, let’s look at the DMA driver.
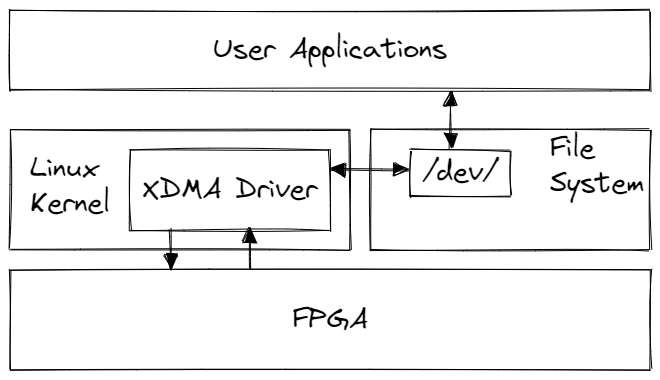
The Xilinx/AWS provides a Linux-based driver running in kernel space that manages the low-level configuration of the DMA hardware on the FPGA. When loaded, the driver creates character-based device files (cdevs) under the /dev/ directory, e.g. /dev/xdma0_user, and /dev/xdma0_h2c_0 . The user application can interact with the FPGA through these device files as if reading and writing to a standard file stored on disk.
Lets see how this looks like from a Rust-based user application perspective:
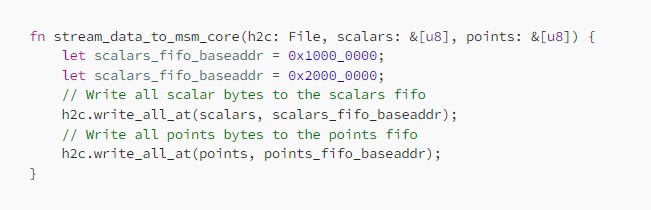
Simple! Except… this will fail if we transfer any significant amount of scalars or points (more than the size of the FIFOs). The transfer will hang and eventually time-out. Why?
The Problem
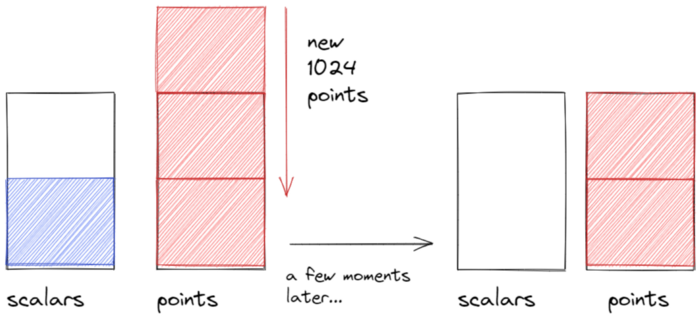
Let’s say our hardware FIFOs are 1K-entries deep. Since our example code is single threaded, we would need to finish transferring all scalars before we start transferring points. We would write the first 1K scalars and then be dead-locked as the MSM core can not consume any scalars before also receiving the corresponding points!
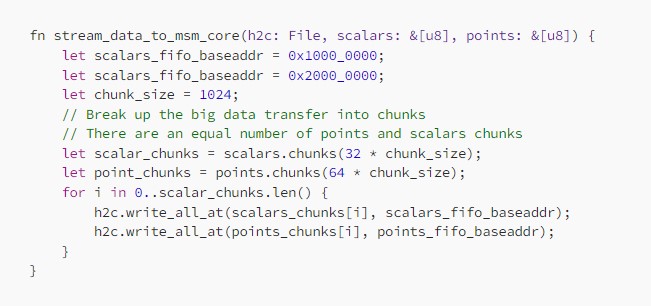
We can consider multi-threading this function, however that opens up further problems we will detail later. Let’s keep the discussion single-threaded for now. So let’s refactor the code to solve the deadlock by splitting the scalars and points vectors into an equal number of chunks. With a chunk size of 1024 we can avoid the deadlock as we will never overflow any FIFO before switching to writing to the other one. So the code will look something like:
Simple! Except… while we are now able to transfer all the data to the MSM core and after a while get the correct result back, performance is poor. Why?
The Rabbit Hole
To get a better understanding and to keep track of the optimizations we will attempt, let’s do some benchmarking. Let’s assume the size of the scalars and points vectors is 220220 elements each. Let’s put a timer around the stream_data_to_msm_core, run it a 200 times and we get the following results:
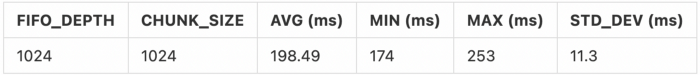
Note the MSM core consumes the data from the FIFOs at its own rate and as far as we are concerned it has finished computation as soon as we finished writing the last chunk. Ok, so our base-line is 198.49 ms average computation time. From our internal simulations, we are sure that there is a lot of performance left on the table here. What’s happening here?
DMA Callback Servicing: Interrupt vs Polling
One of the first suggestions found in the XDMA driver FAQ for addressing poor performance is to try loading the driver in polling mode. What does this mean? To understand this we have to dive into the DMA driver internals.
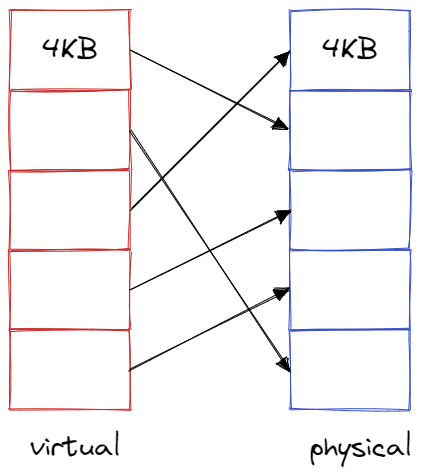
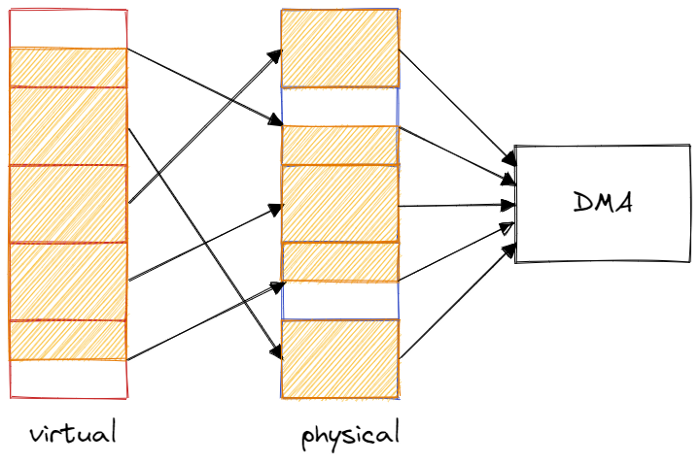
When the user application uses the system call write(buf, size) they send to XDMA driver a pointer to the buffer/array in memory and the number of bytes to write. Of course, the user application only knows about virtual memory addresses and not physical addresses. Conversely the DMA engine on the FPGA only knows about physical addresses. So the driver must convert the pointer to virtual memory to a pointer to physical memory. Recall from Operating Systems 101, that the virtual memory space a user application sees as contiguous is not necessarily contiguous in physical memory. Typically the operating system organizes the memory into 4KB pages of contiguous memory.
The DMA driver must give the DMA engine a list of descriptors which specify where to gather each piece of data from. When the DMA engine is done processing every descriptor, it normally raises an interrupt to the host operating system to say it’s ready for the next transfer. By default, Linux does not provide any guarantees on how quickly it will service this interrupt and wake up the DMA driver. It will typically meander around doing other chores before finally getting to the interrupt. Furthermore, we will incur an additional context switch by waking up the DMA driver. This creates a non-deterministic gap between the end of the previous DMA transfer and the start of the next one.
By turning on polling mode, the driver will never go to sleep and basically continuously asks the DMA if it’s done and immediately sends the next transfer when it receives the go-ahead.
So let’s try it by loading the driver with:

Rerunning the test we get:
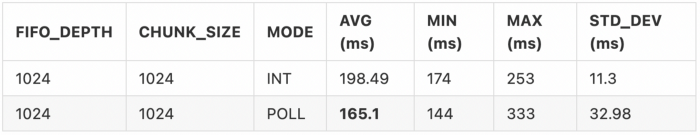
Nice! We are now at 165.1 ms, 83% of the baseline time. But we know we can still do better.
NOTE: We will talk about the increase in the variance later.
Page Alignment
Due to the fact that our data is not contiguous in physical memory, a DMA descriptor can not ask the DMA engine to cross 4KB boundaries, otherwise it might be accessing a totally unrelated memory region. Therefore if our chunk of 1024 scalars (32768-bytes) is not cleanly divisible by 4KB then the DMA engine must process at least one additional descriptor in every transfer.
We can fix this by forcing the allocation of a 4KB aligned buffer. We can do this in Rust like so:
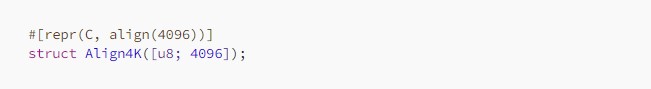
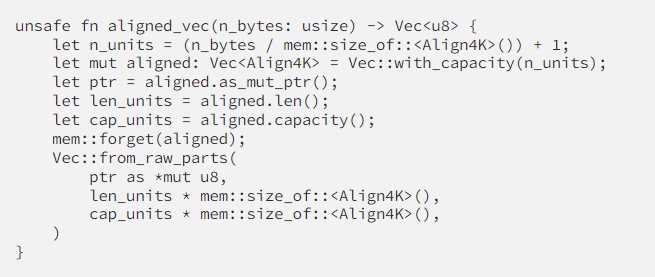
When constructing our original scalars and points vectors we call this aligned_vec function to create our aligned buffers.
Now rerunning the benchmark we get:
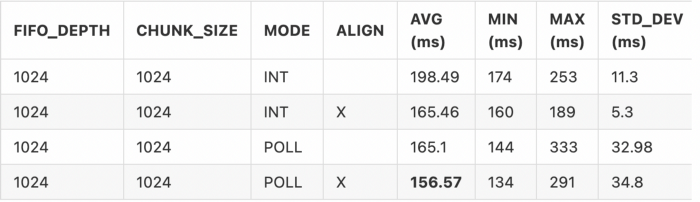
Nice! We see an improvement in both the interrupt and poll mode. However, we know that we can do even better.
Chunk Sizing
Let’s think about the FIFOs again, if we had a FIFO depth of 1K-entries, and we are writing to them in 1K-element chunks, consider the following scenario:
- Both FIFOs are half full, and the host tries to write another chunk of 1024 points.
- The transfer is stalled until all 1024 points have been written.
- The only way this can happen is if all of the 512 existing points/scalar pairs have been consumed by the MSM core.
- So the scalars FIFO will necessarily be starving by the time we initiate another transfer.
- Due to the high latency of a DMA write this means we might be wasting hundreds or thousands of clock cycles between when we finish writing points and when new scalars arrive at the scalars FIFO.
So this basically means that the MSM core can not consume any data while the host is not currently transferring data. Not good!
Lets try to lower the chunk size and see if that helps:
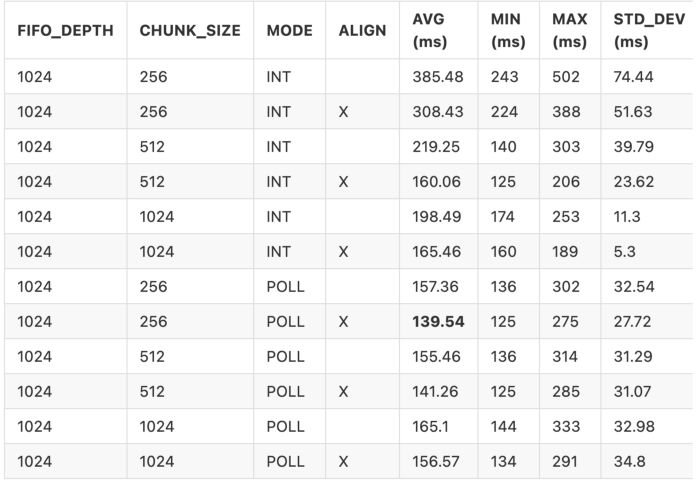
Nice! Now our best time is 139.54 ms! But we know we can still do better!
FIFO Sizing
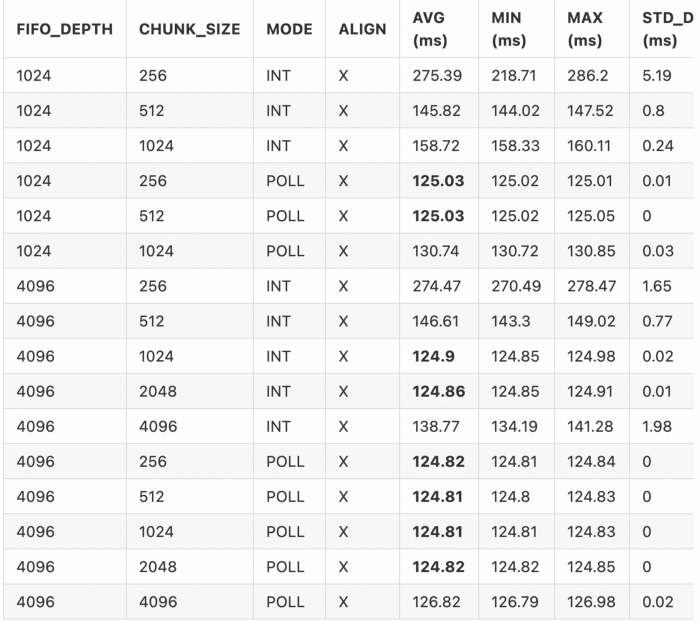
Finally let’s try increasing the size of the FIFOs! We save this to last as we’d rather not have to use extra resources on the FPGA if possible. Increasing the FIFO sizes to 4K-entries, and rerunning the benchmark we get:
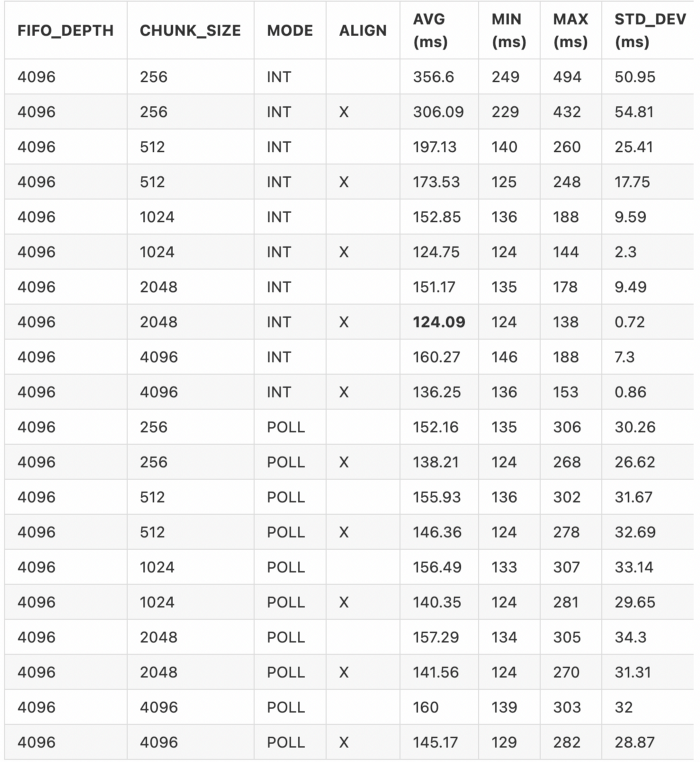
Phew, that’s a lot of permutations. Nice! Our best time is now 124.09 ms, a huge improvement from our baseline of 198.49 ms.
The Zombie
Hmmm… there is still one more question to be answered. Why is the variance so high in general and especially for polling mode? Why does interrupt mode seem to out-perform polling mode now? Theoretically we should expect polling mode to have lower variance…
Let’s open up htop and check what the processor is doing.
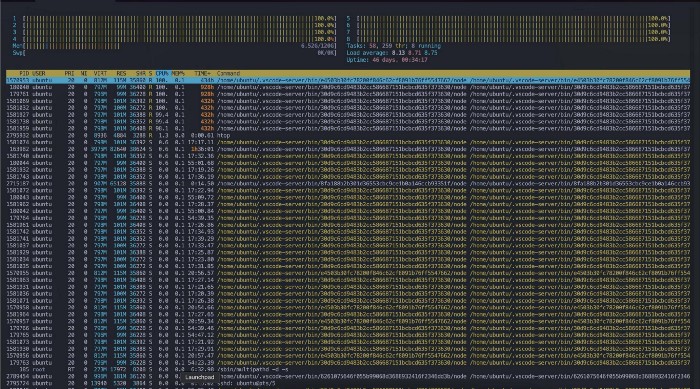
OH MY… Why are the CPUs floored at 100%? And what are all those vscode processes? 928 hours uptime? It looks like we have a zombie vscode outbreak. Turns out this was the cause of our weird variance. After killing all those vscode processes, and rerunning the benchmark:
Ok this is now looking much better! Well now we have a much easier time reaching good speeds.
However, the silver-lining is that at least now we have data on what happens to our DMA transfers when the CPU is under heavy load. In a live production machine this will likely be the case!
NOTE: In the interest of time we only include the page aligned benchmarks.
Concluding Thoughts
Even though we did most of our benchmarks during a vscode zombie plague, each optimization we applied did genuinely improve the performance, however the difference was artificially amplified. Now we know to overprovision our FIFO to 4K-entries even though it would be over-kill when the CPU is mostly idle. Poll mode is great when we have the CPU to spare, but interrupt mode pulls ahead when under load. Above all we need to have a scientific approach to debugging performance issues as there could be many overlapping underlying reasons. Understanding of what’s happening under-the-hood at each layer and applying optimizations in isolation while observing their relative impact is essential to get to the bottom of an issue while learning a lot along the way!
Appendix: A Multi-threaded Alternative
So far we have assumed a single threaded host application. However, the DMA on AWS F1 has four seperate channels that we could take advantage of: xdma0_h2c_0, xdma0_h2c_1, xdma0_h2c_2, and xdma0_h2c_3. So we can spawn two seperate threads and write the chunks in parallel! We can change the code to something like this:
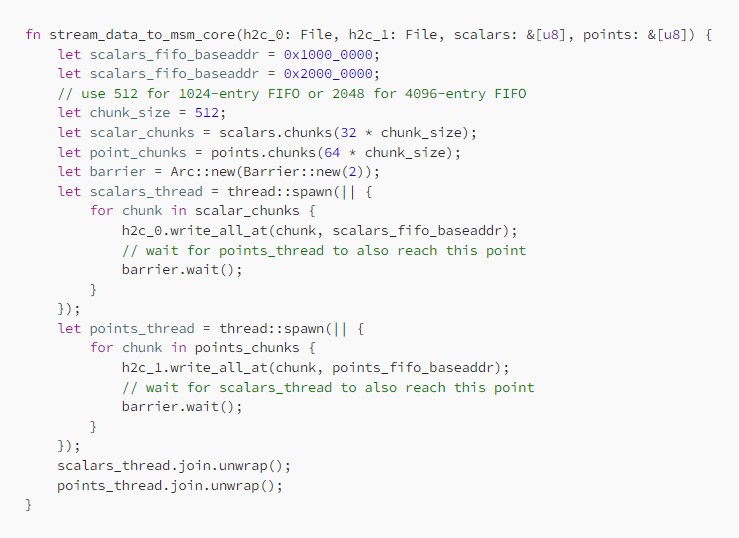
Due to the non-deterministic nature of multi-threaded execution, we need to synchronize both threads after writing each chunk to prevent the same deadlock situation we had in the single threaded version. For example, due to sub-optimal scheduling by the OS, we may end up in a situation where the points thread has finished writing a chunk before the scalars thread has even started. Therefore, we need to have the threads wait until both threads have finished writing before continuing. For similar reasons, we must still keep the chunk size below the full size of the FIFO.
In this fashion hopefully both FIFOs will be filled in parallel (most of the time).
Read this article in its original form on HackMD:


